Digital 2022: The Latest Insights into the State of Digital
By: Zachary Krassin, Digital Marketing Director
We are living through an ongoing wave of digital transformations that is quickly reshaping the world. There’s no question about it — digital continues to accelerate and consume more and more of our lives at an astonishing pace.
With digital media so deeply engrained in every aspect of our lives, we may sometimes take for granted the staggering reach and power it has. So, as the digital revolution continues to develop and shift the way we live, work and play, we thought it would be useful to take a step back and reflect on and contextualize this reach and influence.
Below, we’ve compiled notable statistics and key insights provided by DataReportal’s overview report on digital. We hope you walk away with a deeper understanding of digital’s current state, new milestones and enormous impact. Happy reading!
Digital continues its global expansion
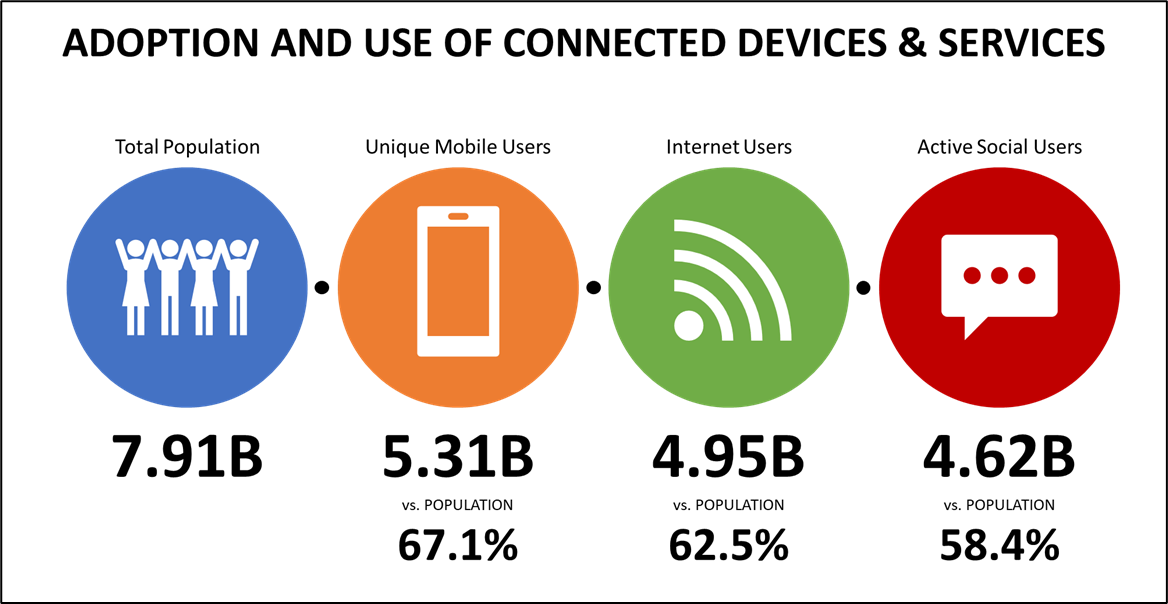
Let’s start by reviewing a broad, worldwide view of digital that begins with adoption and use of connected devices and services to help us understand its astounding reach.
• Global population: The world’s population stood at 7.91 billion in January 2022 and is on pace to reach 8 billion sometime in mid-2023.
• Global mobile users: More than two-thirds (67.1 percent) of the world’s population now uses a mobile phone, with unique users reaching 5.31 billion at the start of 2022.
• Global internet users: Global internet users climbed to 4.95 billion at the start of 2022, with internet penetration now standing at 62.5 percent of the world’s total population.
• Global social media users: There were 4.62 billion social media users around the world in January 2022. This figure is equal to 58.4 percent of the world’s total population. Global social media users have grown by more than 10 percent over the past 12 months, with 424 million new users joining the social media phenomena during 2021.
Digital media continues to consume our days in a MAJOR way
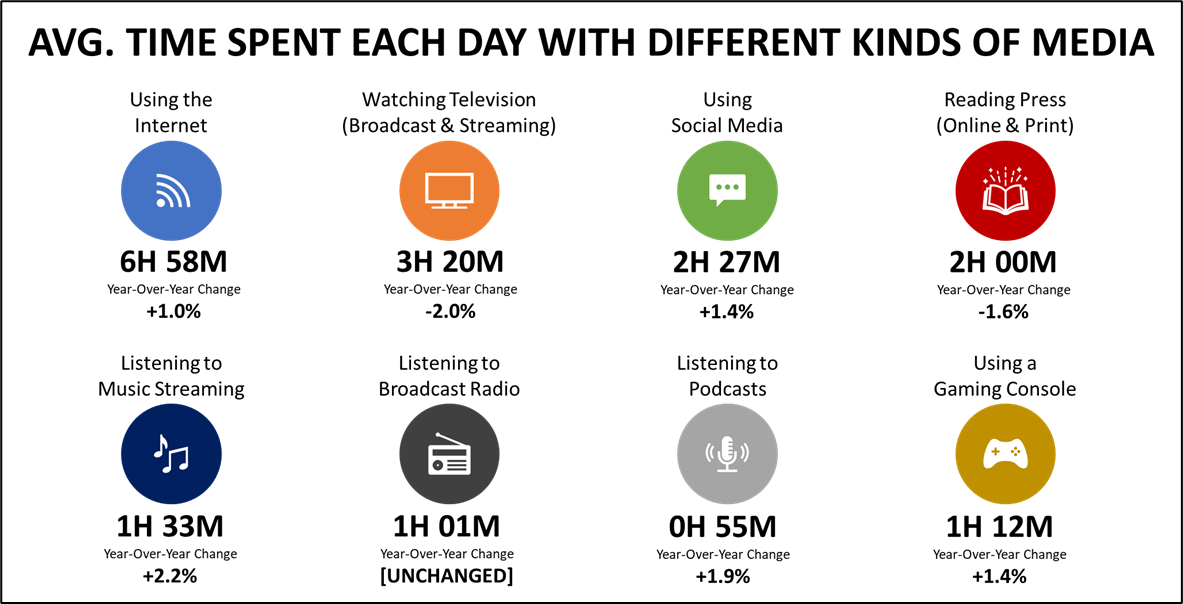
The stats about digital’s global dominance provide valuable context on its adoption and growth, but in order to make sense of what people are actually doing online (short answer: everything) and how long they are spending online (short answer: almost half of their day), we need to dig deeper into media consumption stats and how digital media continues to occupy our lives.
In 2020, US adults spent 13 hours and 38 minutes per day with media — a substantial increase from 2019. Of this total, 7 :50 was spent on digital media. This increase can obviously be attributed to the pandemic and lockdowns, however, even as the world began to open back up in 2021, media consumption barely showed any slowdown. It is estimated that US adults spent 13 hours and 27 minutes per day with media post-2020. Of this total, 60.5% was spent with digital media —and that share will likely increase to 63.7% by 2023 in which digital video, smart phones, CTV, OTT and digital audio will continue to permeate throughout our 24 hours.
YouTube’s ad reach passes 2.5 billion
The latest analysis done by DataReportal reveals that ads on YouTube now reach more than 2.5 billion users – and surprisingly show no signs of slowing down with that figure rising by a hefty 11.9 percent (+271 million users) over the past 12 months. And, that’s just for users in around 75 of the world’s larger economies, so there’s a very good chance that the total reach of YouTube ads is considerably higher. In fact, data indicates that YouTube ads now reach roughly 1 in 3 people on Earth, with that figure rising to 37.7 percent of adults aged 18 and above.
If we focus only on those countries for which data is available, a far more impressive story emerges. YouTube ads now reach more than three-quarters of adults aged 18 and above across most of the Western world.
So, what exactly are all of these people watching on YouTube? That answer would be mostly music — with 11 of the platform’s top 20 search terms over the past year relating directly to music.

Instagram keeps growing
If you thought Instagram had reached its peak in terms of new users– think again. The latest data published in Meta’s advertising resources shows that Instagram’s ad reach has jumped by a surprising 21 percent over the past year.
Meta’s own data suggests that more than a quarter of a billion new users joined Instagram during 2021, pushing the platform’s global ad reach to almost 1.5 billion users at the start of 2022.
What’s more, Instagram’s audience grew by more than 6 percent (+85 million users) in just the past 90 days, which suggests that its growth rates continue to accelerate. DataReportal’s analysis of the company’s ad reach numbers indicates growth of almost 60 percent over the past 2 years.

TikTok’s rapid rise continues
TikTok’s ad audience also continues to grow at a mind-blowing pace. The latest figures published in Bytedance’s advertising resources indicate that TikTok’s ad reach increased by 60 million users (+7.3 percent) in just the past 90 days, taking worldwide ad reach to roughly 885 million by the start of 2022. This data suggests that TikTok has been adding an average of more than 650,000 new users every day over the past 3 months, which equates to almost 8 new users every second.
However, it’s important to mention that this figure doesn’t include users below the age of 18, who likely make up a significant share of the platform’s new users, as data security requirements only show ad reach data for audiences aged 18 and above.
And what’s more, despite widely-held beliefs, TikTok isn’t just popular with younger users. TikTok users aged 18 and above in the United States now equate to more than half (50.3 percent) of all American adults.

When it comes to mobile usage, time is definitely money
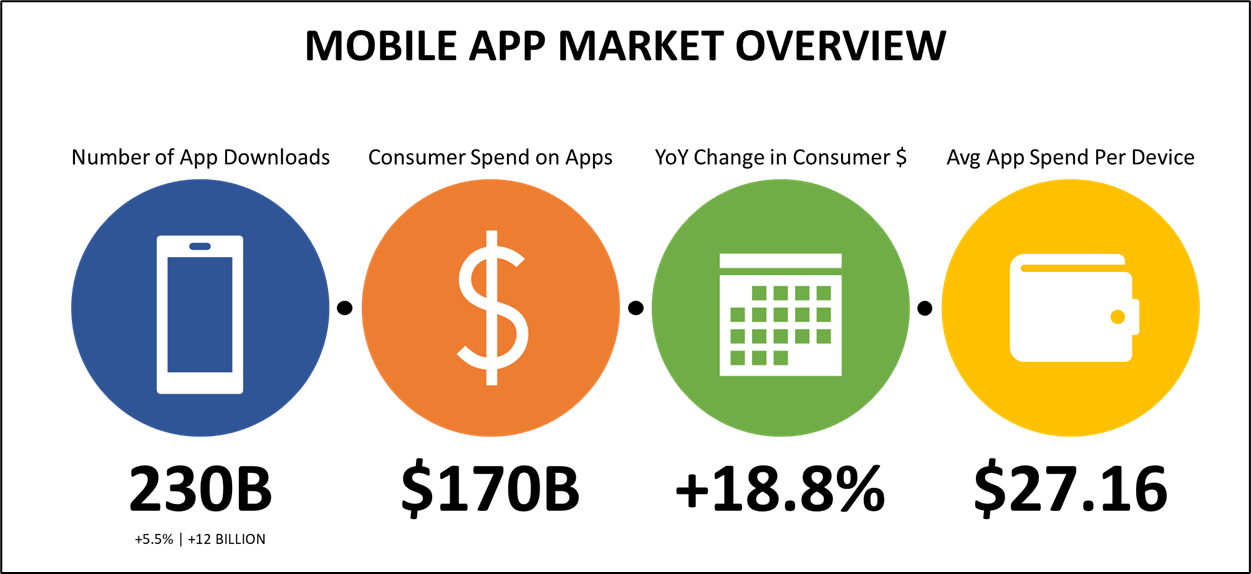
App Annie’s new State of Mobile 2022 report reveals that the typical mobile user now spends an average of 4 hours and 48 minutes per user, per day using their phone. And when it comes to mobile usage, time is definitely money.
In addition to the handset revenues, the world’s smartphone users spent a combined total of USD $170 billion on mobile apps and in-app purchases in 2021. Based on Ericsson’s latest figures, that equates to an average of more than USD $27 per device.
What’s more, these revenue figures only include transactions made directly through app stores, and don’t include things like e-commerce purchases made via mobile apps, or mobile ad revenues.
Additionally, consumer spending on apps continues to rise too, with 2021 revenue increasing by almost 19 percent compared with the total for 2020.
If you expected digital to return to “business as usual” in 2022, you may want to reset those expectations. If anything, the insights outlined above illustrate that digital currently shows no signs of slowing down. If you’re interested in leveraging its astonishing reach and power, contact our digital department today!